P5433 - Guselkumab Pharmacokinetics and Exposure-Response Relationships Are Consistent Following Intravenous versus Subcutaneous Induction in Participants With Crohn’s Disease
Inflammatory Bowel Disease Unit, Division of Gastroenterology and Hepatology, Department of Medicine, University of Calgary, Calgary, AB, Canada Calgary, AB, Canada
Geert R. D’Haens, MD, PhD1, Omoniyi J. Adedokun, PharmD, MSc2, Tae E. Yang, PhD2, Bruce E. Sands, MD, MS, FACG3, Silvio Danese, MD, PhD4, Nat A. Terry, MD, PhD2, Mobolaji Olurinde, MD, PhD2, Rian Van Rampelbergh, MD5, Marion L. Vetter, MD2, Tadakazu Hisamatsu, MD, PhD6, Remo Panaccione, MD7 1Department of Gastroenterology, Amsterdam University Medical Center, Amsterdam, Noord-Holland, Netherlands; 2Johnson & Johnson, Spring House, PA; 3Dr. Henry D. Janowitz Division of Gastroenterology, Icahn School of Medicine at Mount Sinai, New York, NY, USA, New York, NY; 4Gastroenterology and Endoscopy, IRCCS Ospedale San Raffaele and University Vita-Salute San Raffaele, Milan, Lombardia, Italy; 5Johnson & Johnson, Antwerp, Antwerpen, Belgium; 6Department of Gastroenterology and Hepatology, Kyorin University School of Medicine, Tokyo, Tokyo, Japan; 7Inflammatory Bowel Disease Unit, Division of Gastroenterology and Hepatology, Department of Medicine, University of Calgary, Calgary, AB, Canada, Calgary, AB, Canada Introduction: Guselkumab (GUS), a dual-acting IL-23p19 subunit inhibitor, is highly efficacious in participants (pts) with Crohn’s disease (CD) after intravenous (IV) or subcutaneous (SC) induction followed by SC maintenance. This analysis characterized pharmacokinetics (PK) and exposure-response (E-R) for both administration routes and confirmed assumptions for the development of IV and SC induction formulations. Methods: GUS efficacy and safety in pts with moderate to severely active CD were evaluated in the phase 2 GALAXI 1 (200, 600, or 1200 mg IV at week [W]0, W4, and W8), phase 3 GALAXI 2 and 3 (200 mg IV at W0, W4, and W8), and phase 3 GRAVITI studies (400 mg SC at W0, W4, and W8). All studies used treat-through designs and the same SC maintenance dose regimens (100 mg q8w or 200 mg q4w). With an estimated ~50% bioavailability of SC GUS, the 2-fold higher SC induction dose was predicted to provide similar overall exposure and noninferior trough concentrations compared with the IV dose.
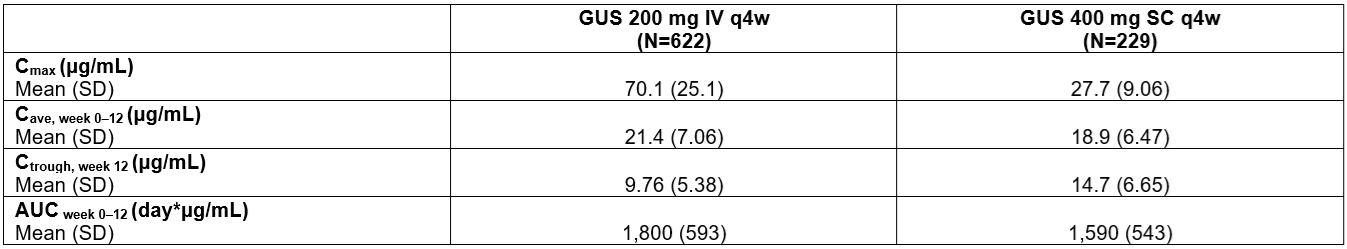
To characterize GUS PK, a population PK model was used to simulate exposure metrics for IV and SC induction using individual post-hoc PK parameters and actual pt dosages. Relationships between GUS exposure and select efficacy endpoints (clinical response, clinical remission, and endoscopic response) at week 12 were assessed. Results: SC induction resulted in higher trough serum concentrations (at W12), lower peak serum concentrations, similar average concentrations (W0–W12), and similar area under the concentration-time curves (W0–W12) vs IV induction (Table). Regardless of induction route (IV or SC) or maintenance regimen, GUS serum concentrations reached steady state by W24.
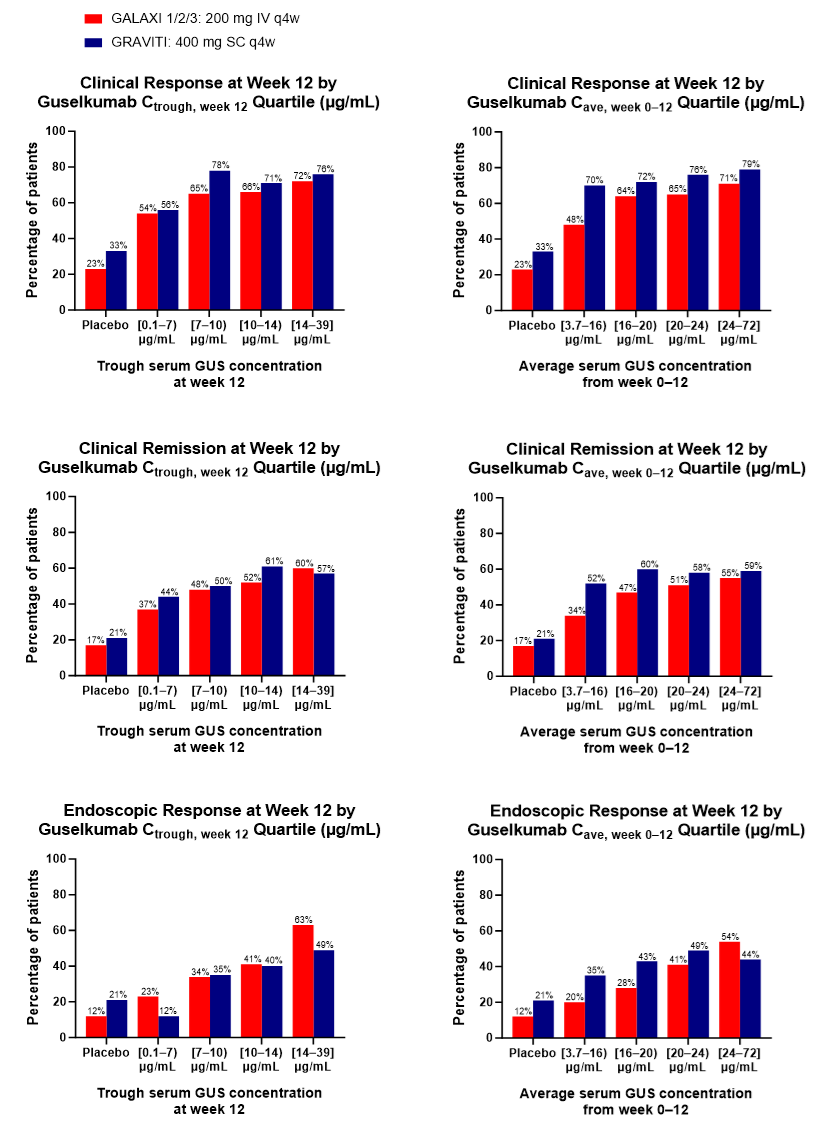
W12 efficacy outcomes were comparable within GUS concentration quartiles after SC vs IV induction (Figure). Although pts with higher serum GUS concentrations tended to achieve greater W12 efficacy outcomes, this trend was no longer evident after accounting for a pt’s drug clearance or the half-life of the drug. W48 outcomes were similar in pts who received the same maintenance regimen, regardless of induction dose route. No positive E-R trends were seen between peak concentration and W12 efficacy endpoints; thus, the higher peak concentration observed with IV induction did not seem to improve efficacy. Discussion: Average serum GUS concentrations and E-R relationships were similar after IV vs SC induction, supporting the use of either administration route and induction dose regimen in CD patients.
Figure: Table. Exposure Metrics at Week 12 After IV (200 mg) or SC (400 mg) Induction Regimens. AUCweek 0–12=area under the concentration-time curve from week 0 to week 12 (induction); Cave, week 0–12=average concentration from week 0 to week 12 (induction); Cmax=maximum concentration; Ctrough, week 12=trough concentration at week 12 (induction); IV=intravenous; PK=pharmacokinetic; q4w=every 4 weeks; SC=subcutaneous; SD=standard deviation.
Figure: Figure. Clinical Response, Clinical Remission, and Endoscopic Response Outcomes at Week 12 for Guselkumab Trough Serum Concentration Quartiles at Week 12 and Guselkumab Average Serum Concentration Quartiles from Baseline to Week 12 Following IV Induction in GALAXI (200 mg IV q4w x3) or SC Induction in GRAVITI (400 mg SC q4w x3). Cave=average concentration; Cave, week 0–12=average concentration from week 0 to week 12 (induction); Ctrough=trough concentration; Ctrough, week 12=trough concentration at the end of the induction period; IV=intravenous; q4w=every 4 weeks; SC=subcutaneous.
Geert R. D’Haens, MD, PhD1, Omoniyi J. Adedokun, PharmD, MSc2, Tae E. Yang, PhD2, Bruce E. Sands, MD, MS, FACG3, Silvio Danese, MD, PhD4, Nat A. Terry, MD, PhD2, Mobolaji Olurinde, MD, PhD2, Rian Van Rampelbergh, MD5, Marion L. Vetter, MD2, Tadakazu Hisamatsu, MD, PhD6, Remo Panaccione, MD7. P5433 - Guselkumab Pharmacokinetics and Exposure-Response Relationships Are Consistent Following Intravenous versus Subcutaneous Induction in Participants With Crohn’s Disease, ACG 2025 Annual Scientific Meeting Abstracts. Phoenix, AZ: American College of Gastroenterology.
 photo")