P5307 - Pharmacokinetics and Exposure-Response Relationships of Guselkumab Intravenous or Subcutaneous Induction in Participants With Ulcerative Colitis
University of Chicago Medicine Inflammatory Bowel Disease Center, Chicago, IL, USA Chicago, IL
Laurent Peyrin-Biroulet, MD, PhD1, Zhenhua Xu, MD, PhD, FCP2, Jie Shao, PhD2, Tadakazu Hisamatsu, MD, PhD3, Millie D. Long, MD, FACG4, Silvio Danese, MD, PhD5, Matthew Germinaro, MD2, Marion L. Vetter, MD2, Shadi Yarandi, MD2, Thomas Baker, MD2, Jessica R.. Allegretti, MD, MPH6, David T. Rubin, MD7 1Department of Gastroenterology, CHRU Nancy, INSERM NGERE, Université de Lorraine, France, Vandœuvre-lès-Nancy, Lorraine, France; 2Johnson & Johnson, Spring House, PA; 3Department of Gastroenterology and Hepatology, Kyorin University School of Medicine, Tokyo, Tokyo, Japan; 4Division of Gastroenterology and Hepatology, University of North Carolina at Chapel Hill, Chapel Hill, NC, USA, Chapel Hill, NC; 5Gastroenterology and Endoscopy, IRCCS Ospedale San Raffaele and University Vita-Salute San Raffaele, Milan, Lombardia, Italy; 6Division of Gastroenterology, Hepatology, and Endoscopy, Brigham and Women’s Hospital, Harvard Medical School, Boston, MA; 7University of Chicago Medicine Inflammatory Bowel Disease Center, Chicago, IL, USA, Chicago, IL Introduction: Guselkumab (GUS), a dual-acting IL-23p19 subunit inhibitor, is highly efficacious in participants (pts) with ulcerative colitis (UC) after intravenous (IV) or subcutaneous (SC) induction, followed by SC maintenance therapy. Here, we evaluated the pharmacokinetics (PK) and exposure-response (E-R) of IV and SC GUS induction. Methods: The GUS clinical development program in pts with moderately to severely active UC consisted of the phase 2b/3 QUASAR studies of IV induction (200 mg every 4 weeks [q4w] x3) and SC maintenance (100 mg every 8 weeks [q8w] or 200 mg q4w) and the phase 3 ASTRO study of SC induction (400 mg q4w x3) and SC maintenance (same as QUASAR). All studies had randomized, double-blind, placebo-controlled, parallel group designs.
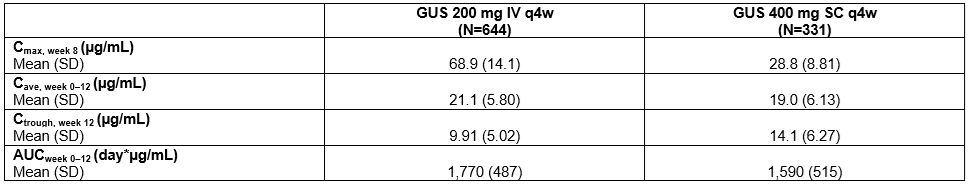
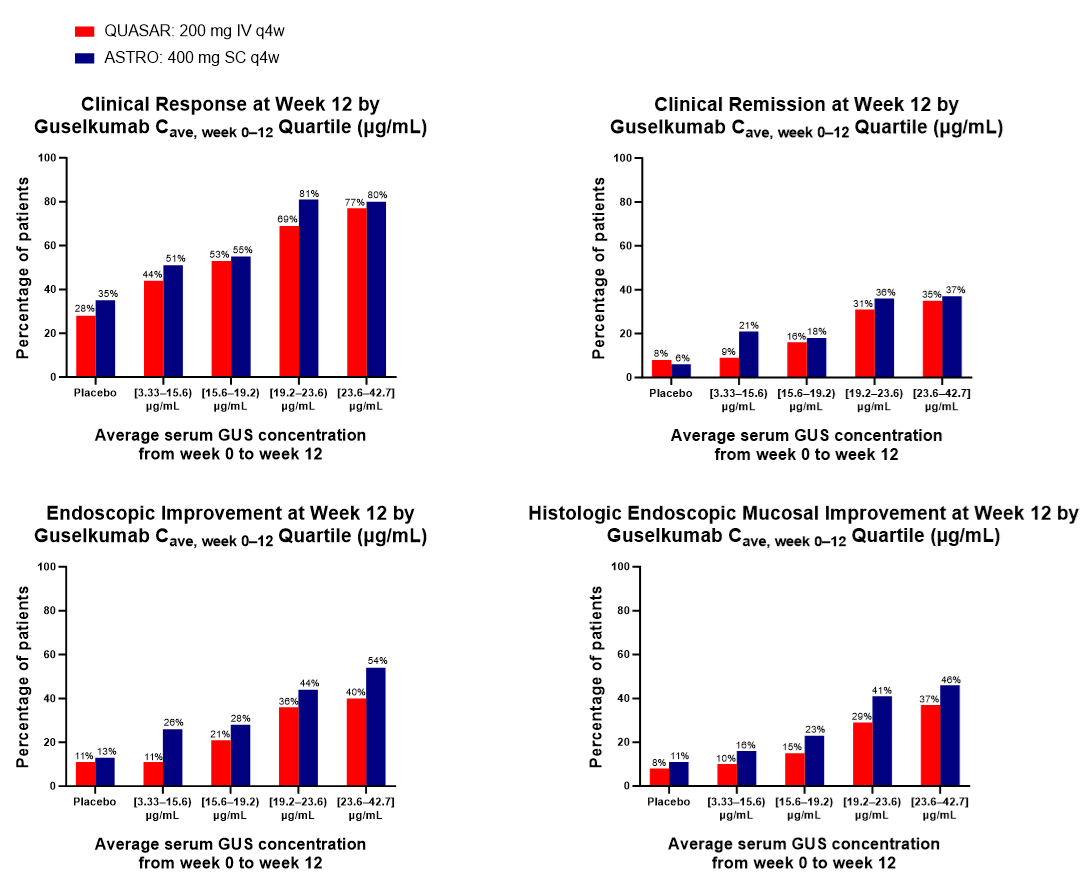
To compare GUS PK exposure after 200 mg IV vs 400 mg SC induction through week 12 (W12), individual post-hoc PK parameter values (estimated with the established QUASAR 2-compartment linear population PK [popPK] model with first-order absorption and elimination) and pt dosing information from QUASAR and ASTRO were used to simulate concentration-time profiles and calculate individual induction exposure metrics. Comparative graphical E-R analysis (QUASAR vs ASTRO) was conducted for key W12 efficacy outcomes (clinical remission, clinical response, endoscopic improvement, and histologic-endoscopic mucosal improvement) using the overall exposure during induction (Cave, week 0–12) and associated exposure quartiles from the combined study populations. Results: Consistent with model predictions, SC induction resulted in similar average concentrations (W0–W12), similar area under the concentration-time curves (W0–W12), lower peak concentrations (at W8), and higher trough concentrations (at W12) compared with the PK profile of IV induction (Table). GUS steady-state concentration was reached by W24, and popPK model-based simulations showed that serum GUS concentrations were comparable by W24 after the same maintenance dose regimen, regardless of induction administration route. Key efficacy outcomes at W12 were comparable within the same GUS concentration quartiles following IV vs SC induction (Figure). Similar positive E-R trends were observed after IV or SC induction. Discussion: Consistent average serum GUS concentrations and E-R patterns after IV and SC induction underscore the observed clinical efficacy and support the use of either induction administration route in UC patients.
Figure: Table. Comparison of Model-predicted Guselkumab PK Exposures Following 200 mg IV q4w and 400 mg SC q4w Induction Doses. AUCweek 0–12=area under the concentration-time curve from week 0 to week 12 (induction); Cave, week 0–12=average concentration from week 0 to week 12 (induction); Cmax, week 8=maximum concentration at week 8; Ctrough, week 12=trough concentration at week 12 (induction); IV=intravenous; N=number of participants; PK=pharmacokinetic; q4w=every 4 weeks; SC=subcutaneous; SD=standard deviation.
Figure: Figure. Week 12 Efficacy Endpoints by Serum GUS Concentration Quartiles in QUASAR (200 mg IV q4w) and ASTRO (400 mg SC q4w). Clinical response was defined as a ≥30% reduction and a ≥2-point decrease from induction baseline in the modified Mayo score, with either a ≥1-point decrease in the rectal bleeding subscore or a rectal bleeding subscore of 0 or 1. Clinical remission was defined as a stool frequency subscore of 0 or 1 (with no increase from induction baseline), a rectal bleeding subscore of 0, and an endoscopy subscore of 0 or 1 with no friability. Endoscopic improvement was defined as an endoscopy subscore of 0 or 1 with no friability. Histologic-endoscopic mucosal improvement was defined as a combination of histologic healing and endoscopic healing, where histologic healing is defined as neutrophil infiltration in <5% of crypts, no crypt destruction, and no erosions, ulcerations, or granulation tissue according to the Geboes grading system. Cave, week 0–12=average concentration from week 0 to week 12; IV=intravenous; q4w=every 4 weeks; SC=subcutaneous.
Laurent Peyrin-Biroulet, MD, PhD1, Zhenhua Xu, MD, PhD, FCP2, Jie Shao, PhD2, Tadakazu Hisamatsu, MD, PhD3, Millie D. Long, MD, FACG4, Silvio Danese, MD, PhD5, Matthew Germinaro, MD2, Marion L. Vetter, MD2, Shadi Yarandi, MD2, Thomas Baker, MD2, Jessica R.. Allegretti, MD, MPH6, David T. Rubin, MD7. P5307 - Pharmacokinetics and Exposure-Response Relationships of Guselkumab Intravenous or Subcutaneous Induction in Participants With Ulcerative Colitis, ACG 2025 Annual Scientific Meeting Abstracts. Phoenix, AZ: American College of Gastroenterology.