Johns Hopkins Bloomberg School of Public Health Baltimore, MD
John K. Appiah, MD1, George S. Blewusi, MD2, Nikita Garg, MD1, Ewurabena N. Plange-Kaye, DDS3, Emmanuel Asare, 4 1Geisinger Wyoming Valley Medical Center, Wilkes-Barre, PA; 2Johns Hopkins Bloomberg School of Public Health, Baltimore, MD; 3Columbia University, Dumont, NJ; 4Montefiore hospital, Bronx, NY Introduction: Hepatitis C virus (HCV) mortality patterns in the United States have evolved significantly over the past two decades, coinciding with the opioid epidemic and subsequent introduction of direct-acting antivirals. Rural-urban disparities in HCV mortality have been documented, but temporal trends across different epidemic phases remain poorly characterized.
Methods: We analyzed crude HCV-related mortality rates per 100,000 population from CDC WONDER database for 2000–2023. Counties were classified as rural or urban using National Center for Health Statistics (NCHS) classifications. Trends were analyzed across three time periods: pre-epidemic (2000–2009), opioid epidemic era (2010–2021), and post-epidemic (2021–2023). Percent change in mortality was calculated for each geography and time period.
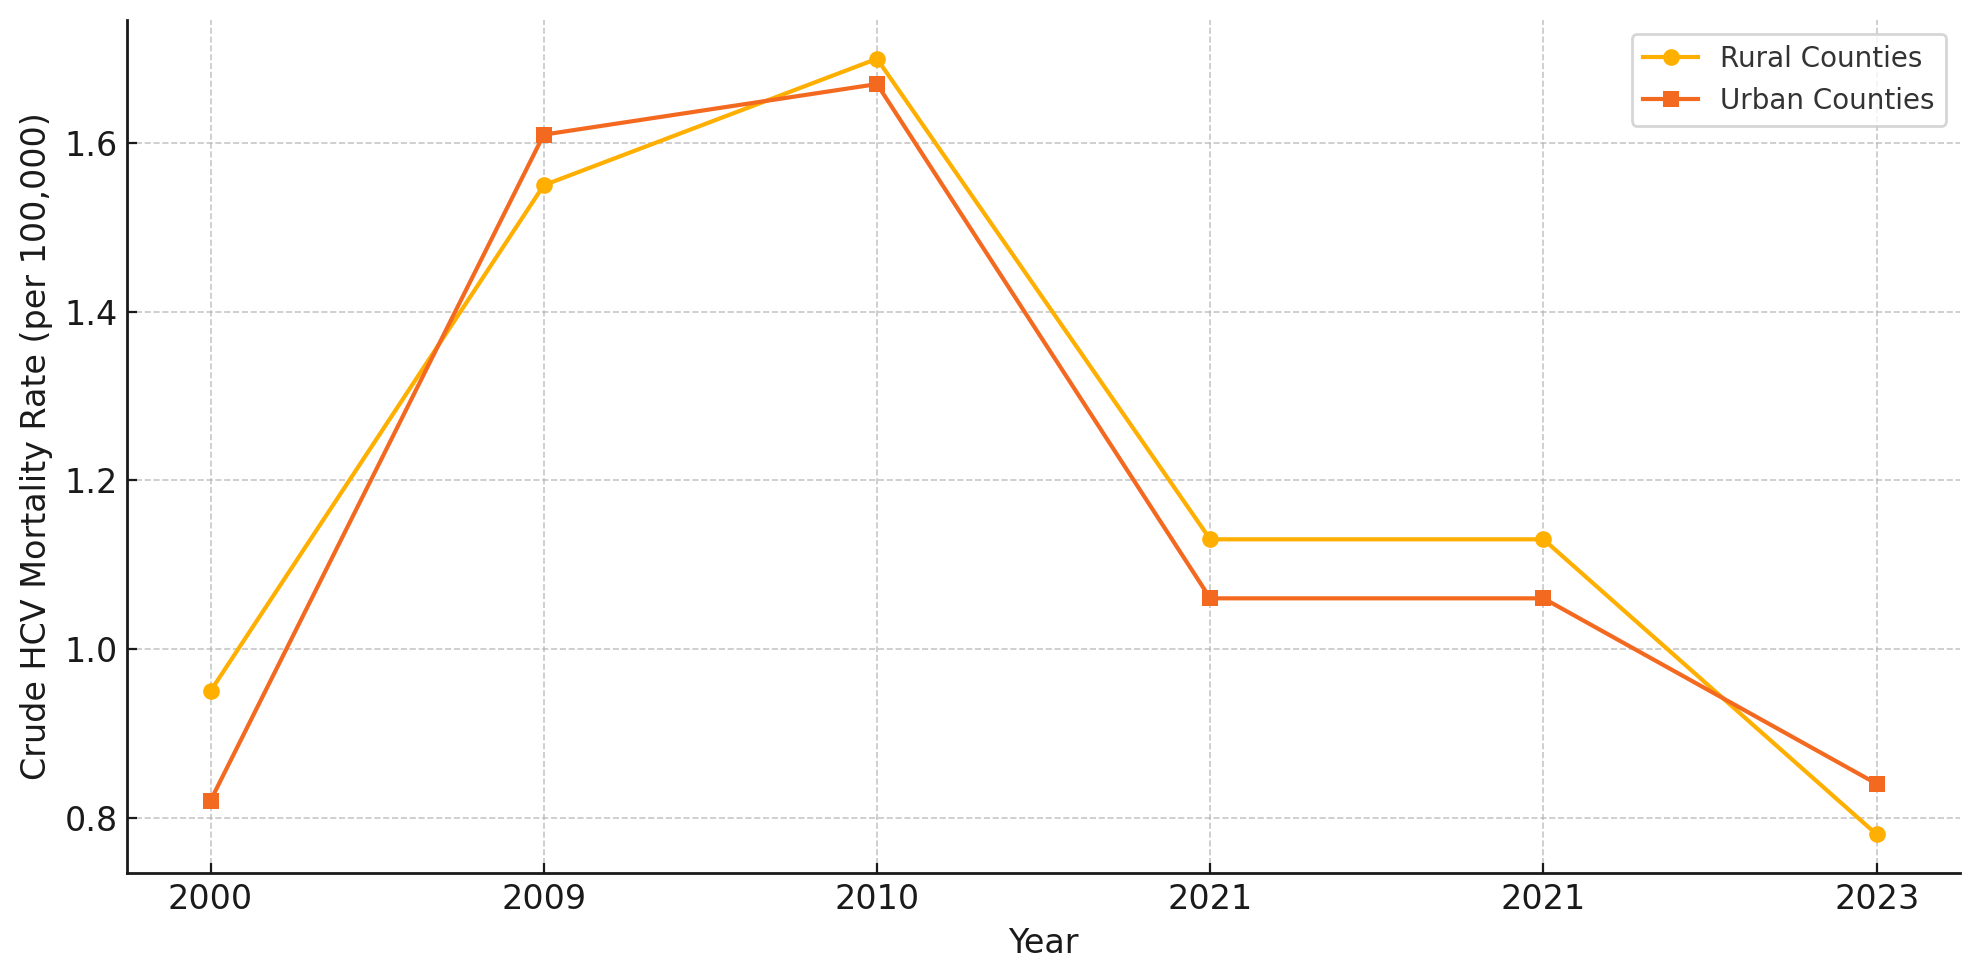
Results: Rural HCV mortality increased 63.5% during the pre-epidemic period (0.95 to 1.55 per 100,000), while urban mortality increased 97.1% (0.82 to 1.61 per 100,000). Both geographies peaked around 2010-2011, followed by sustained declines. During the epidemic era, rural mortality decreased 33.2% (1.70 to 1.13 per 100,000) and urban mortality decreased 36.7% (1.67 to 1.06 per 100,000). In the post-epidemic period (2021-2023), rural areas showed accelerated decline of 30.9% (1.13 to 0.78 per 100,000) compared to 21.1% urban decline (1.06 to 0.84 per 100,000). By 2023, rural-urban mortality rates achieved near-parity (rural-to-urban ratio: 0.94:1), representing a reversal from historical rural disadvantage.
Discussion: HCV mortality patterns demonstrate distinct temporal phases with notable geographic convergence. While urban areas experienced steeper initial increases during the pre-epidemic period, rural counties now show more favorable recent trends, achieving lower mortality rates than urban areas by 2023. These findings suggest differential effectiveness of interventions across geographic settings and highlight the need for continued efforts to expand testing, treatment, and harm reduction services, particularly in rural areas.
Figure: Figure 1: Crude HCV-related mortality rates per 100,000 population in rural and urban U.S. counties at key time points from 2000 to 2023. The data reflect changes across three epidemic phases: pre-epidemic (2000–2009), epidemic (2010–2021), and post-epidemic (2021–2023). Rural and urban mortality rates rose through 2010–2011, then declined, with rural areas achieving lower rates than urban areas by 2023.
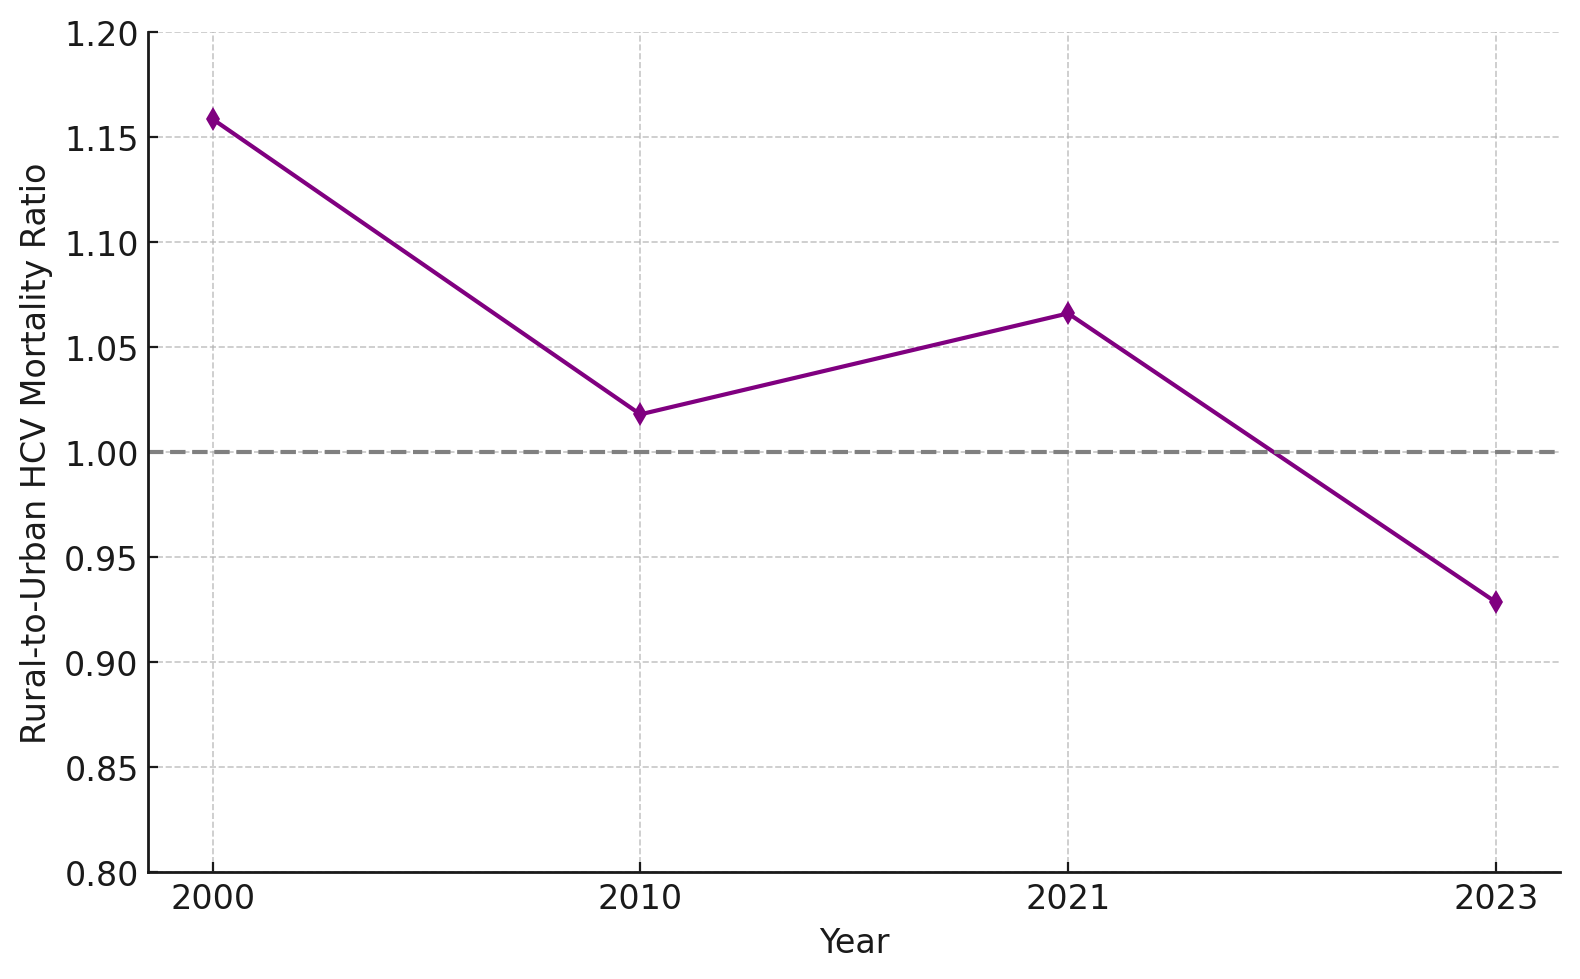
Figure: Figure 2: Rural-to-urban HCV mortality ratio from 2000 to 2023. The ratio reflects the relative mortality burden between rural and urban counties, with values above 1.0 indicating higher rural mortality. A historical rural disadvantage persisted through 2021 but reversed by 2023, when rural mortality fell below urban levels, achieving near-parity.
Disclosures: John Appiah indicated no relevant financial relationships. George Blewusi indicated no relevant financial relationships. Nikita Garg indicated no relevant financial relationships. Ewurabena Plange-Kaye indicated no relevant financial relationships. Emmanuel Asare indicated no relevant financial relationships.
John K. Appiah, MD1, George S. Blewusi, MD2, Nikita Garg, MD1, Ewurabena N. Plange-Kaye, DDS3, Emmanuel Asare, 4. P1682 - Hepatitis C Mortality Trends in Rural and Urban US Counties During the Opioid Epidemic, ACG 2025 Annual Scientific Meeting Abstracts. Phoenix, AZ: American College of Gastroenterology.

 photo")