Varun Jain, MD1, Justin-James Chua, MD1, Nikita Garg, MD2, Tushar Abhinav, MD3, Shruthi Sethuraman, MD1, Paarth Kapadia, MD1, Nanditha Venkatesan, MD1, Lizeth Cifuentes, MD1 1University of Pittsburgh Medical Center, Pittsburgh, PA; 2Geisinger Wyoming Valley Medical Center, Wilkes-Barre, PA; 3The Wright Center for Graduate Medical Education, Scranton, PA Introduction: The redefinition of metabolic dysfunction-associated steatotic liver disease (MASLD) emphasizes its connection to cardiometabolic risk and replaces the term NAFLD to reduce stigma and simplify diagnosis. However, this simplification may overlook heterogeneity among affected individuals. Identifying patient sub-populations may guide more specific management. To address this gap, we applied unsupervised clustering to identify distinct MASLD phenotypes and examine how they differ in metabolic, hepatic, and demographic traits. Methods: We analyzed U.S. adults (≥18 years) from NHANES 2017–2018 with complete transient elastography, laboratory, and anthropometric data. K-means clustering was performed on scaled variables: liver stiffness (LSM), steatosis (CAP), BMI, waist circumference, glucose, triglycerides (TG), HDL, and blood pressure. MASLD was defined as ALT ≥40 U/L with ≥2 metabolic risk factors (BMI ≥25 kg/m2, TG ≥150 mg/dL, glucose ≥100 mg/dL, or low sex-specific HDL). Clusters were compared by liver traits, MASLD prevalence, fibrosis-4 (FIB-4) score, age, sex, and race/ethnicity. Results: Among 3,415 participants, four distinct clusters emerged.
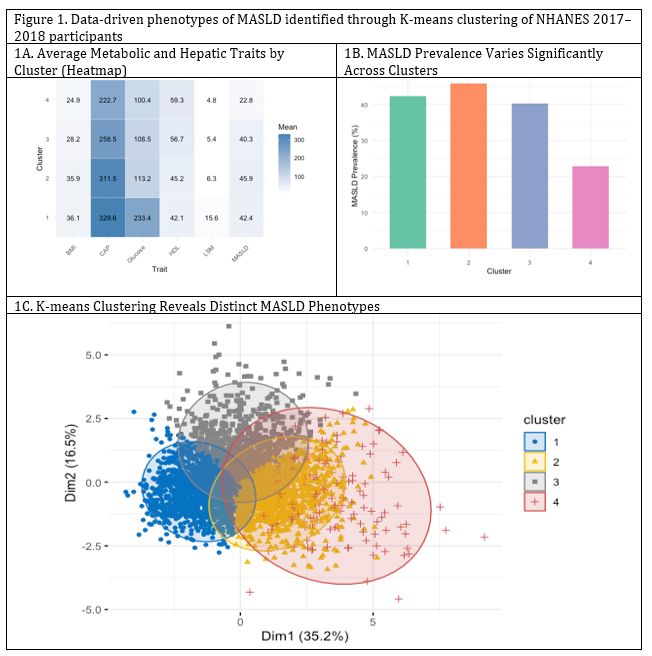
Cluster 1, Young Males with Advanced Fibrosis (n=165): Most fibrotic (LSM 15.6 kPa), highest ALT and FIB-4, with 42.4% MASLD prevalence. Predominantly younger males, and Hispanic and non-Hispanic Black individuals.
Cluster 2, Metabolically Obese with Severe Steatosis (n=1,110): Metabolically obese (BMI 35.9, glucose 113.2, CAP 311.5), highest MASLD prevalence (45.9%). Balanced by age and sex; 38% non-Hispanic White.
Cluster 3, Overweight Individuals with Moderate Steatosis (n=727): Overweight with moderate steatosis (CAP 258.5), relatively preserved HDL; MASLD in 40.3%. Slight male predominance; 35% non-Hispanic Black.
Cluster 4, Lean, Low-Risk, Metabolically Healthy (n=1,413): Leanest profile (BMI 24.1, CAP 222.7, LSM 4.8), highest HDL, and lowest MASLD prevalence (22.8%). Skewed female and younger. Despite differing metabolic profiles, MASLD prevalence remained substantial (23–46%), and ALT/FIB-4 tracked with liver stiffness. Discussion: This clustering approach identified four distinct MASLD phenotypes, revealing important metabolic and demographic differences. These findings highlight MASLD as a spectrum, not a single disease state. Data-driven phenotyping may enable more precise screening, risk stratification, and personalized interventions, critical next steps in improving care for this common and often stigmatized condition.
Figure: Figure 1. Data-driven phenotypes of MASLD identified through K-means clustering of NHANES 2017–2018 participants (a) Heatmap displaying average metabolic and hepatic traits by cluster (b) MASLD prevalence varies significantly across clusters (c) K-means clustering reveals distinct MASLD phenotypes
Disclosures: Varun Jain indicated no relevant financial relationships. Justin-James Chua indicated no relevant financial relationships. Nikita Garg indicated no relevant financial relationships. Tushar Abhinav indicated no relevant financial relationships. Shruthi Sethuraman indicated no relevant financial relationships. Paarth Kapadia indicated no relevant financial relationships. Nanditha Venkatesan indicated no relevant financial relationships. Lizeth Cifuentes indicated no relevant financial relationships.
Varun Jain, MD1, Justin-James Chua, MD1, Nikita Garg, MD2, Tushar Abhinav, MD3, Shruthi Sethuraman, MD1, Paarth Kapadia, MD1, Nanditha Venkatesan, MD1, Lizeth Cifuentes, MD1, 32, Phenotyping MASLD Using Unsupervised Clustering of Liver and Metabolic Traits in NHANES (2017–2018), ACG 2025 Annual Scientific Meeting Abstracts. Phoenix, AZ: American College of Gastroenterology.