P0909 - Seasonal Variations and Peak Hospitalizations Among Patients With Upper Gastrointestinal Bleeding: A Retrospective National Inpatient Sample Database Analysis From 2016-2022
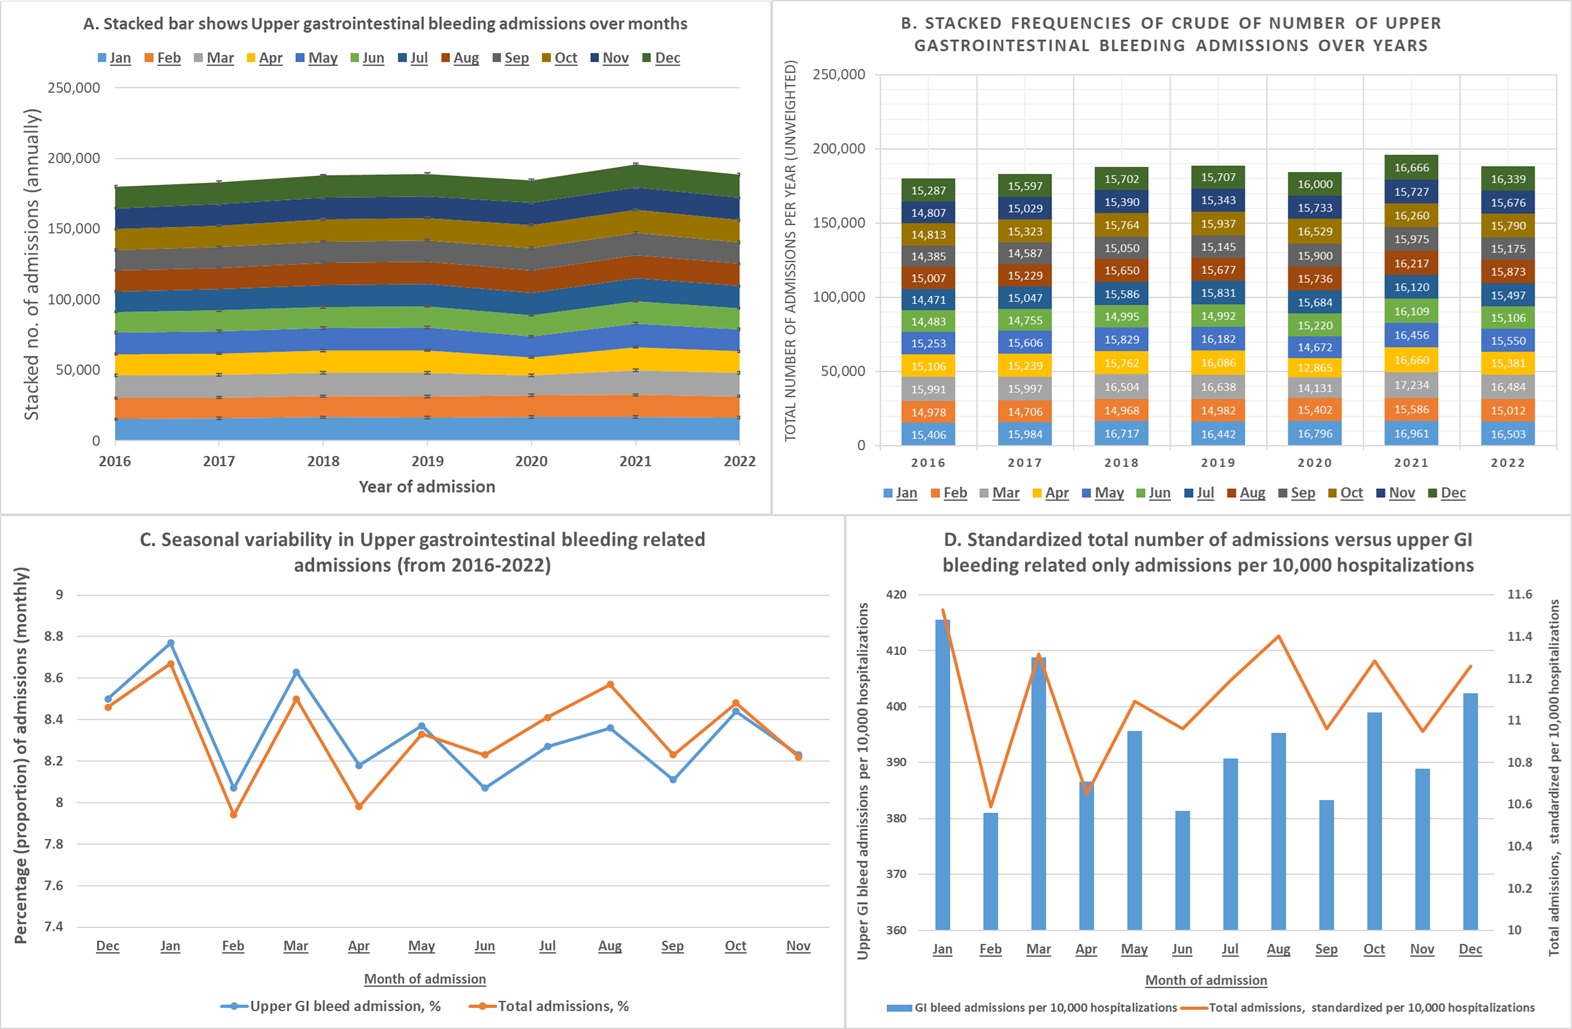
Abuoma Ekpendu, DO, Muhammad Sohaib Asghar, MD, WooJoo Lee, MD, Pankajkumar Patel, MD, Martin E. Avalos, MD, Thomas Shimshak, MD AdventHealth, Sebring, FL Introduction: Upper gastrointestinal bleeding (UGIB) remains a significant cause of morbidity and hospitalizations in the United States. Previous studies suggest a seasonal component to UGIB incidence, but national-level trends remain underexplored. Our objective is to examine seasonal variation and identify peak hospitalization periods for UGIB using a nationally representative database spanning from 2016 to 2022. Methods: We conducted a retrospective cohort analysis using the National Inpatient Sample (NIS) database from 2016 to 2022. All patients without any age restrictions applied on index hospitalization with a principal diagnosis of UGIB identified using ICD-10-CM codes were included. Monthly and seasonal trends in UGIB admissions were analyzed. Poisson regression was employed to assess the association between seasonality (winter season: December to May) and UGIB admissions, adjusting for overall monthly hospital admissions using an offset. Unweighted and unadjusted datasets were used for trend analysis. Hospitalizations were standardized per 10,000 for generalized linear regression model. Results: A total of 1,310,608 UGIB hospitalizations with a mean age of 65.36 years were identified during the study period. Total unweighted hospitalization for the study period included 48,200,376 patients with a considerably lower mean age (49.75 years). Male to female ratio for UGIB hospitalizations is almost 1:2. UGIB hospitalizations significantly increased after the onset of COVID-19 pandemic (2020 onwards) as shown in Table 1. A consistent seasonal pattern was observed, with peak UGIB admissions occurring during the winter months (December–May) when compared general all-cause hospitalization rates as shown in Figure 1. Poisson regression analysis revealed a significantly higher incidence rate of UGIB admissions during the winter season compared to the rest of the year (IRR = 1.246, Poisson regression coefficient 4.77 [95% CI: 3.59–5.76], p < 0.001), after adjusting for total admissions. Discussion: UGIB hospitalizations in the United States demonstrate a clear seasonal pattern, with a significant increase during the December up to May within the last decade. Postulated hypothesis includes NSAID use for seasonal flu or pneumonia and holiday alcohol consumption during the season. Understanding this variation may help guide resource planning, preventive strategies, and risk mitigation for at-risk populations during peak periods.
Figure: Figure 1: (A). Stacked bar shows Upper gastrointestinal bleeding admissions over months; (B). Stacked frequencies of crude of number of upper gastrointestinal bleeding admissions over years; (C). Seasonal variability in Upper gastrointestinal bleeding related admissions (from 2016-2022); (D). D. Standardized total number of admissions versus upper GI bleeding related only admissions per 10,000 hospitalizations.
Figure: Seasonal variability defined as December-May (Dependent variable) versus June-November. B: unstandardized coefficient; β: Standardized coefficient beta; GI: gastrointestinal; CI: confidence interval.
Disclosures: Abuoma Ekpendu indicated no relevant financial relationships. Muhammad Sohaib Asghar indicated no relevant financial relationships. WooJoo Lee indicated no relevant financial relationships. Pankajkumar Patel indicated no relevant financial relationships. Martin E. Avalos indicated no relevant financial relationships. Thomas Shimshak indicated no relevant financial relationships.
Abuoma Ekpendu, DO, Muhammad Sohaib Asghar, MD, WooJoo Lee, MD, Pankajkumar Patel, MD, Martin E. Avalos, MD, Thomas Shimshak, MD. P0909 - Seasonal Variations and Peak Hospitalizations Among Patients With Upper Gastrointestinal Bleeding: A Retrospective National Inpatient Sample Database Analysis From 2016-2022, ACG 2025 Annual Scientific Meeting Abstracts. Phoenix, AZ: American College of Gastroenterology.

.jpg "Abuoma Ekpendu, DO photo")