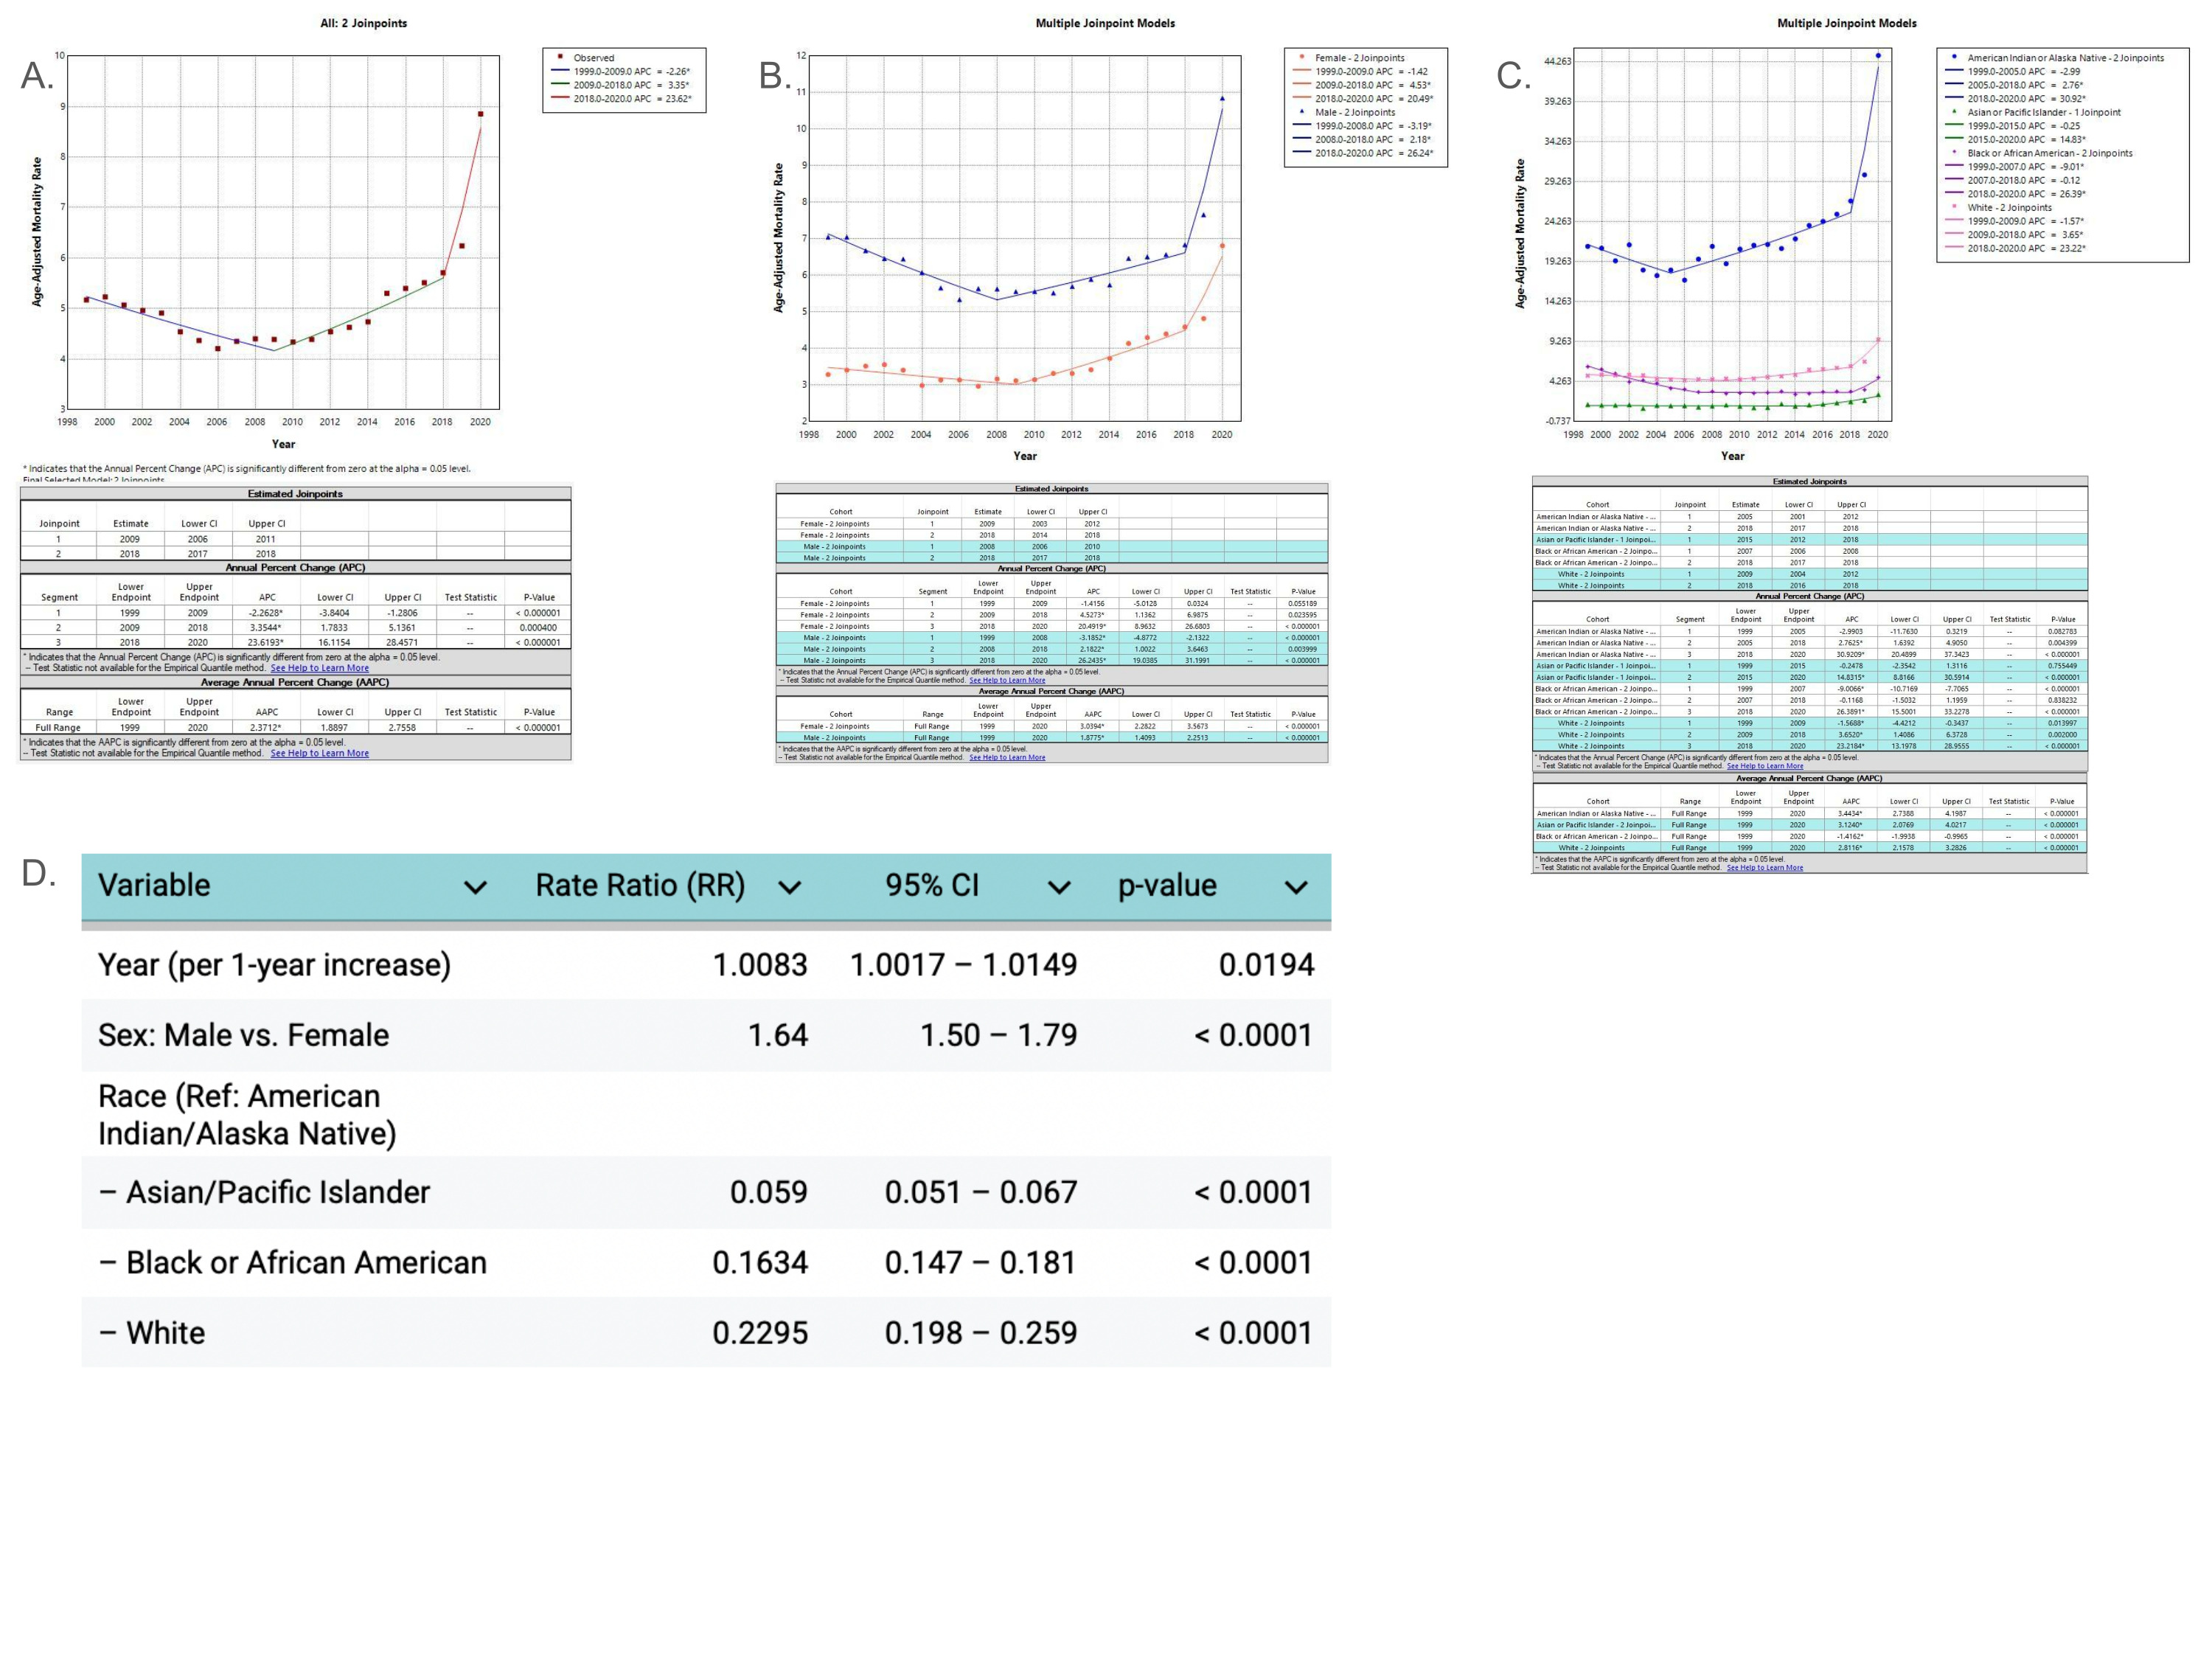
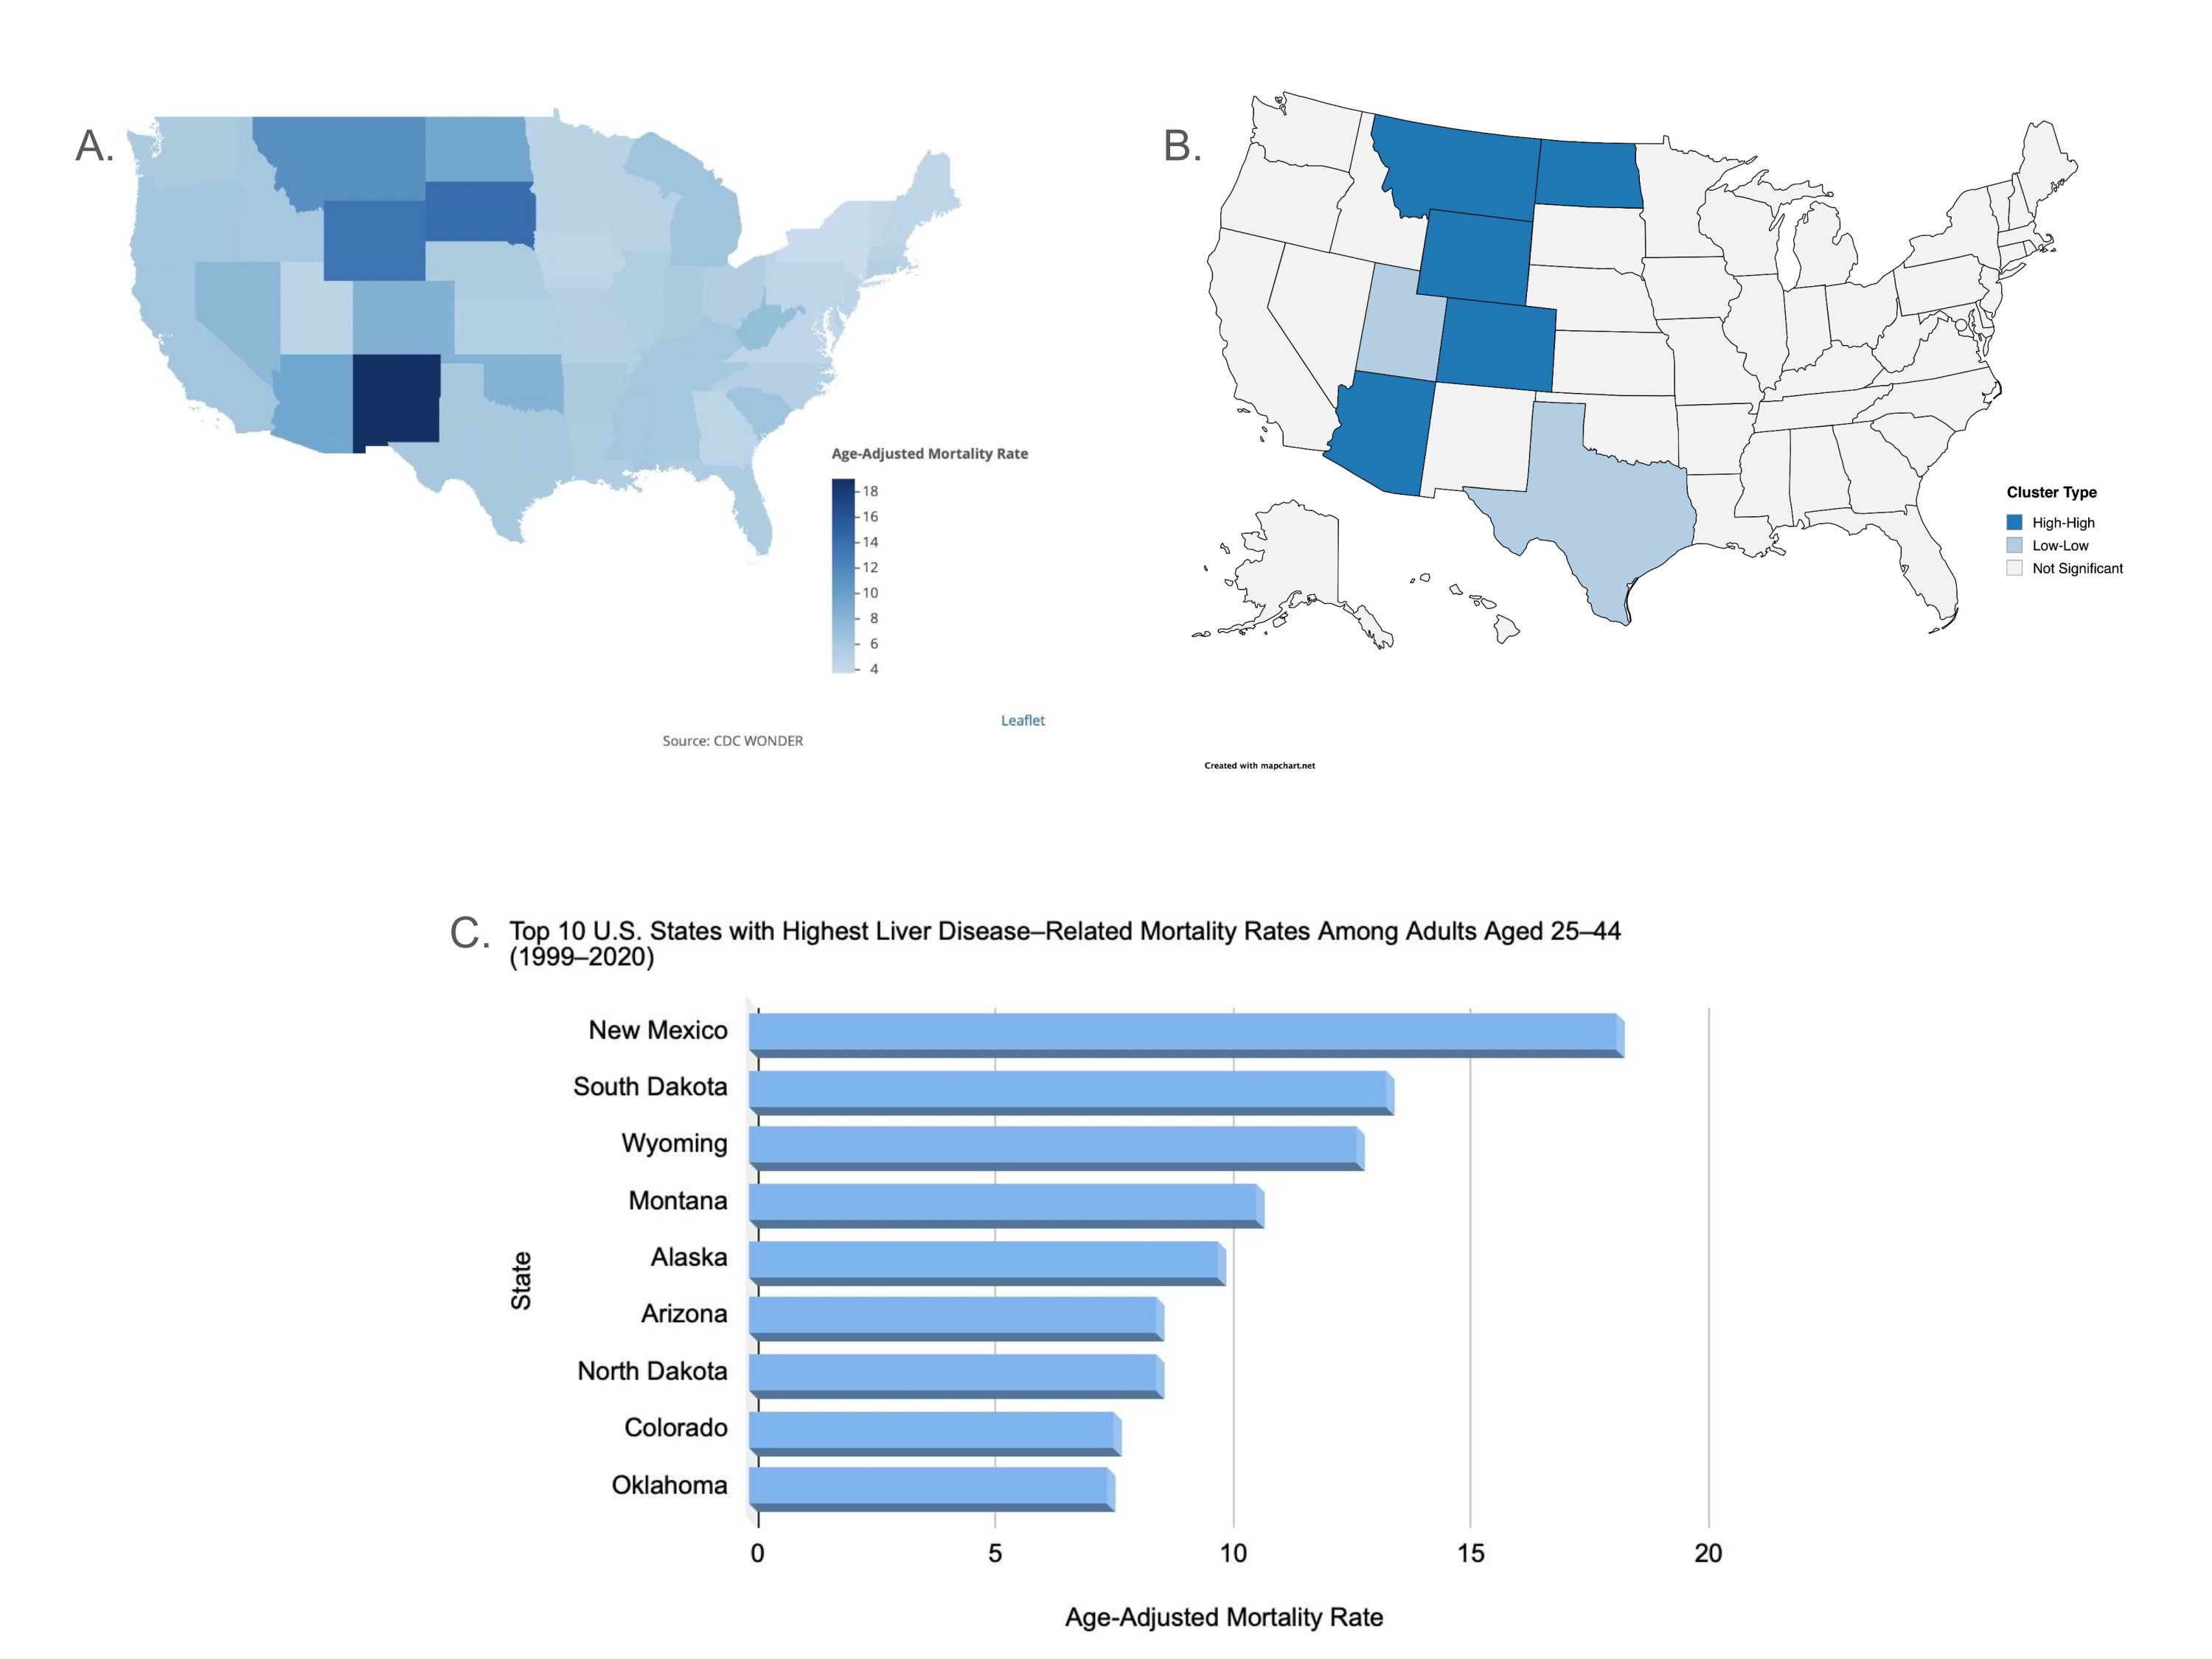
Shanthi Reddy Sripathi, MD1, Rithik Naik Korra, MBBS2, Nikhil Kumar Balagoni, MBBS2, Samiya Saher, MBBS2, Sana Rahman, MBBS2, Rithvika Rathod, MD3 1Einstein Medical Center, Philadelphia, PA; 2Osmania General Hospital and Medical College, Hyderabad, Telangana, India; 3Jersey City Medical Center, Jersey City, NJ Introduction: Liver disease mortality is rising in the United States, with disproportionate impacts on younger populations. Adults aged 25–44 years represent a critical demographic, yet national mortality trends and disparities within this group remain understudied. This study examines temporal, demographic, and geographic patterns in liver disease-related mortality among U.S. adults aged 25–44 years. Methods: We analyzed CDC WONDER database (1999–2020) to identify liver-related deaths (ICD-10: K70–K74, K75.4, K76.0) among adults aged 25–44. Age-adjusted mortality rates (AAMRs) per 100,000 were calculated and stratified by race, sex, and state. Temporal trends were evaluated using the Joinpoint Regression Program (version 5.4.0) to estimate annual percentage change (APC) and average annual percentage change (AAPC). Negative binomial regression modeled mortality counts by year, sex, and race with population offsets. State-level mortality was visualized using choropleth maps, and geographic hotspots were identified using Moran’s I. Analyses were performed in R software (version 4.3.2). Results: Between 1999 and 2020, liver disease accounted for 89,336 deaths among adults aged 25-44 in the U.S. The AAMR increased from 5.17 in 1999 to 8.85 in 2020 (AAPC 2.37; 95% CI: 1.89 to 2.75, p< 0.000001) with a sharp rise from 2018 to 2020 (APC 23.61; 95% CI: 16.11 to 28.45, p< 0.000001). American Indians had the highest burden (AAMR 23.05), with rates rising from 21.18 to 45.04 (AAPC 3.44; 95% CI: 2.73–4.19, p< 0.000001). Negative binomial regression showed that each additional year was associated with a 0.83% increase in mortality (RR = 1.0083, p = 0.0194). Males had a 63.8% higher mortality rate than females (RR = 1.64, p < 0.0001). Compared to American Indians, mortality was significantly lower among Asians by 94.1% (RR = 0.059), Blacks by 83.7% (RR = 0.1634), and Whites by 77.1% (RR = 0.2295), all p < 0.0001. Choropleth maps revealed statistically significant clusters of high liver-related mortality in states including New Mexico, South Dakota, Alaska, and Montana, aligning with areas of high American Indian populations. Hotspot analysis confirmed significant spatial clustering (Moran’s I = 0.32, p < 0.01). Discussion: Liver-related mortality among young adults is increasing, with American Indians and certain geographic regions disproportionately affected. These findings highlight the need for targeted public health interventions and policies that prioritize the hotspot regions to reduce liver-related mortality.
Figure: Temporal Trends by Year (A), Sex (B), and Race (C) from Joinpoint Regression, and Mortality Predictors (D) from Negative Binomial Modeling (Ages 25-44, 1999-2020)
Figure: State-Level Liver Disease-Related Mortality: Geographic Distribution (A), Hotspots (B), and Top 10 States (C) (Ages 25–44, 1999-2020)
Disclosures: Shanthi Reddy Sripathi indicated no relevant financial relationships. Rithik Naik Korra indicated no relevant financial relationships. Nikhil Kumar Balagoni indicated no relevant financial relationships. Samiya Saher indicated no relevant financial relationships. Sana Rahman indicated no relevant financial relationships. Rithvika Rathod indicated no relevant financial relationships.
Shanthi Reddy Sripathi, MD1, Rithik Naik Korra, MBBS2, Nikhil Kumar Balagoni, MBBS2, Samiya Saher, MBBS2, Sana Rahman, MBBS2, Rithvika Rathod, MD3. P3822 - Young and Dying: Demographic and Geospatial Disparities in Liver Disease-Related Mortality Among Young Adults Aged 25-44 in the US, ACG 2025 Annual Scientific Meeting Abstracts. Phoenix, AZ: American College of Gastroenterology.